Formative Assessment: numpy : Answers to exercises
Exercise 1
Recall from previous sections how to retrieve a MODIS LAI dataset for a particular date. Recall also values of greater than 100 are invalid, and that a scaling of 0.1 should be applied to the LAI.
- Load a MODIS LAI dataset SDS
Lai_500mfor tileh17v03day of year 41, 2019. - Call the 2D array
dataand confirm that it has a shape (2400, 2400) - build a mask called
maskof invalid pixels - print the percentage of invalid pixels to 2 decimal places (hint: sum with
sum) - scale the data array as appropriate to obtain LAI
- set invalid data values to 'not a number'
np.nan - display the resulting image
# ANSWER
import numpy as np
import matplotlib.pyplot as plt
from geog0111.modisUtils import modisAnnual
from osgeo import gdal

kwargs = {
    'tile'      :    ['h17v03'],
    'product'   :    'MCD15A3H',
    'sds'       :    ['Lai_500m'],
    'doys'       : [41],
    'year'      : 2019,
}

filename,bandname = modisAnnual(verbose=False,**kwargs)
print(f'filename:\n{filename}')
print(f'bandname:\n{bandname}')
filename:
{'Lai_500m': 'work/output_filename_YEAR_2019_DOYS_41_41_SDS_Lai_500m.vrt'}
bandname:
['2019-041']
# read VRT file using gdal
data = {}
for sds, fn in filename.items():
    g = gdal.Open(fn)
    if g:
        data[sds] = g.ReadAsArray()
    print(f"sub-dataset {sds} has the shape of {data[sds].shape}")
sub-dataset Lai_500m has the shape of (2400, 2400)
# get Lai data from the data dict
lai_data = data['Lai_500m']

# build a mask called 'mask' of invalid pixels
mask = (lai_data > 100)

# count the percentage of invalid pixels
perc = mask.sum() / (mask.shape[0] * mask.shape[1]) * 100
print(f'invalid pixels take up {perc:.2f}%')
invalid pixels take up 77.22%
# scale the data array as appropriate to obtain LAI
lai_data = lai_data * 0.1

# set invalid data values to 'not a number' np.nan
lai_data[mask] = np.nan
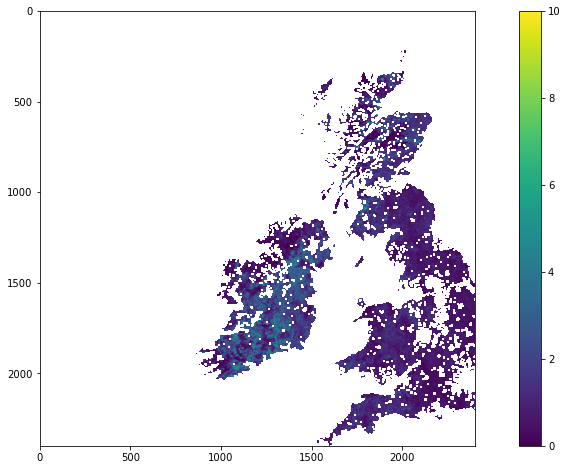
# plot image data: use vmin and vmax to set limits
fig, axs = plt.subplots(1,1,figsize=(16,8))
im = axs.imshow(lai_data,vmax=10,interpolation=None)
fig.colorbar(im, ax=axs)
<matplotlib.colorbar.Colorbar at 0x7febdb7f0210>
Last update:
December 6, 2022