Assessed Practical Part A
Introduction
Task overview
In this task, you will be writing codes that download and interpret (convert units) two datasets of the Del Norte catchment in Colorado, USA for the years 2016-2019 inclusive (i.e. 4 years of data). The main coding exercise is a Python script that when you run it, downloads the data and stores them in CSV format files. In a notebook, you should display the script, run the script, show the results and produce plots of the datasets.
You must submit a single notebook, converted to PDF file to Turnitin.
Submission
The due dates for the two formally assessed pieces of coursework are:
    Part A 15 Nov, 2021 (50% of final mark) - first Monday after reading week.
    Part B: 10 Jan, 2022 (50% of final mark) - first day of term 2
The practical comes in two parts : (A) data preparation (50%); (B) modelling (50%)
Submission is through the usual Turnitin link on the course Moodle page.
You must submit everything in a single notebooks as a pdf files.
Checklist
- You should be submitting a single PDF file derived from a (single) Jupyter notebook that contains codes and output to fulfill the aims of this practical submission.
- You MUST run the notebook (from start to finish) to prove that the codes work, so we will expect to see cells starting at
[1]and continuing sequentially. If they are out of order, you have not shown that the code works. - Look over the requirements to make sure you have completed all parts.
- Make sure you read the advice on computer codes and plagiarism
Background
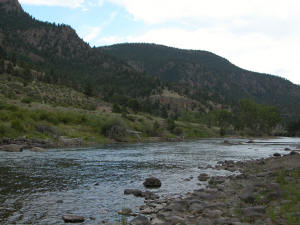
The hydrology of the Rio Grande Headwaters in Colorado, USA is snowmelt dominated. It varies considerably from year to year and may very further under a changing climate. One of the tools we use to understand monitor processes in such an area is a mathemetical ('environmental') model describing the main physical processes affecting hydrology in the catchment. Such a model could help understand current behaviour and allow some prediction about possible future scenarios.
In part 2 of your assessment you will be using, calibrating and validating such a model that relates temperature and snow cover in the catchment to river flow.
We will use the model to describe the streamflow at the Del Norte measurement station, just on the edge of the catchment. You will use environmental (temperature) data and snow cover observations to drive the model. You will perform calibration and testing by comparing model output with observed streamflow data.
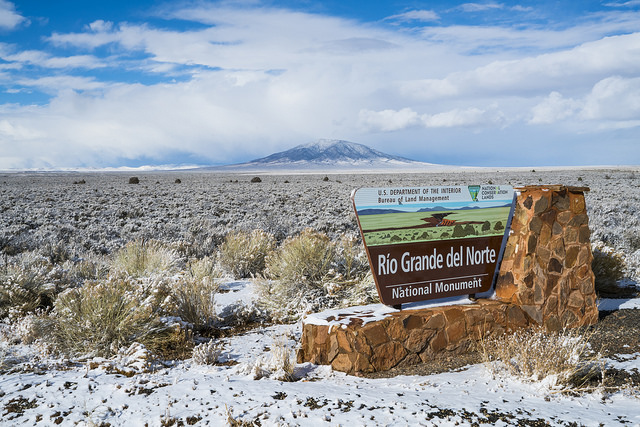
Del Norte
Further general information is available from various websites, including NOAA.
You can visualise the site Del Norte 2E here.
Requirements for this submission
In this part of the assessment, you will need to write computer codes to read, interpret and plot the various environmental datasets we will be using in Part 2,
To complete this practical you will need to access, read, save and plot the following datasets:
-
Stream discharge from the USGS http://waterdata.usgs.gov.
-
Temperature: Temperature data from:
- the Colorado State Climate data site OR
- a local copy of the data from the Colorado State Climate data site.
The problem with the Colorado State Climate data site is that you cannot directly query or download the data. Instead you will need to manually save the data, most easily by copying and pasting the data columns into a file. The final option is a copy of the data from the Colorado State Climate data site. We try to keep this up to date on an annual basis, but cannot guarantee that. You may choose which method you use, but you may find it useful to explore the climate data sites further rather than simply relying on the dataset we have prepared.
Access
You should examine the data on the site links above and make sure you understand the file format and data characteristics.
Units
You need to make a note of the units the physical parameters (temperature, discharge etc.) datasets are presented in as you will need to convert them to the units we specify below. The temperature data from the Colorado State Climate data site comes in Fahrenheit.
Header
Make a note of the number of 'header' lines in the files (if any) and the column headings (if given) as you may need to specify these when reading the dataset.
Data access
Before going further, you should use a Jupyter notebook or iPython in a terminal to make sure you can access and interpret these files. There are only two files, so this should not take too long.
You will most likely want to use pandas to do this, and should have gained experience in this already in the course. Try first to use the dataset URL to load into pandas, except if you download the Colorado State Climate data site to a file (then, read from that file). You may need to try out several options in reading the data into pandas if it does not automatically load correctly. In that case, remember that you can skip header lines, and get pandas to read only the data lines. You should be able to print the pandas dataframe to see that the data in your table corresponds to what you can see when you access data with a URL.
Task 1: Data preparation code
In this task, you must write a series of documented and commented Python functions within a Jupyter notebook, show the documentation (help()), run the functions for multiple years, and demonstrate the results.
We are expecting the following:
odict = get_DelNorte_data(year)
Create a commented and documented function called get_DelNorte_data that has the following argument:
year : integer, between 2000 and the year previous to now (i.e. not this year)
and that returns a dictionary OR pandas dataframe containing:
    doy      : array of 365/366 values with the day of year
    flow     : stream flow data for each in units of megalitres/day
               (ML/day i.e. units of 1000000 litres a day)
    maxt     : Maximum daily temperature in Celcius (C)
You can use multiple sub-functions that you call from you function, should you so wish.
plot_DelNorte_data(year,dict)
Create a well commented and documented function called plot_DelNorte_data that has the following arguments:
    year     : integer, between 2000 and the year previous to now (i.e. not this year)
    dict     : data dictionary (or pandas Dataframe) containing doy, flow, maxt
that plots maxt, and flow data as a function of dayOfYear, for a particular year. It should have suitable axis labels and titles, and have the ability to save the plot to a graphics file.
Your code should be well-commented to explain what you are doing. The graphs should be clear, with appropriate titles and axis labels.
You could go further with this function should you wish, and read in a list of dictionaries and a list of years (or a similar construct) and position the 4 years of data in a 2x2 grid of sub-plots.
ofile = write_DelNorte_data(year,dict)
Create a well commented and documented function called write_DelNorte_data that has the following arguments:
    year     : integer, between 2000 and the year previous to now (i.e. not this year)
    dict     : data dictionary (or pandas Dataframe) containing doy, flow, maxt
that saves the information in the data dictionary for the year given to a file work/delNorteYYYY.csv in CSV format with table headings for each column derived from the dictionary keys, where YYYY is the year in question
Run all 3 functions and show the outputs
Run the functions for the years 2016 to 2019 inclusive and demonstrate the outputs.
Hints: Don't forget to include the various packages you need at the top of the file. Don't forget to put docstrings and comments in your file and functions.
Coursework
You need to submit you coursework in the usual manner by the date given above.
You must work individually on this task. If you do not, it will be treated as plagiarism. By reading these instructions for this exercise, we assume that you are aware of the UCL rules on plagiarism. You can find more information on this matter in your student handbook. If in doubt about what might constitute plagiarism, ask one of the course conveners.
Structure of the Report
The required elements of the notebook are given below. Yiu must label them as separate sections (or sub-sections)
odict = get_DelNorte_data(year) [40%]
- Code function that downloads the required temperature and river discharge data and returns a data dictionary or table with
doy,maxt, andflow - Function help (from a comprehensive docstring) accessed by
help(get_DelNorte_data)
plot_DelNorte_data(year,dict) [15%]
- Code function that plots
Max Temperature, andDischargedata as a function ofdayOfYear, for a particular year. It should have suitable axis labels and titles, and have the ability to save the plot to a graphics file. - Function help (from a comprehensive docstring) accessed by
help(plot_DelNorte_data)
ofile = write_DelNorte_data(year,dict) [15%]
- Code function
write_DelNorte_data(year,dict)that saves the information in the data dictionary for the year given to a filework/delNorteYYYY.csvin CSV format with table headings for each column derived from the dictionary keys, whereYYYYis the year in question - Function help (from a comprehensive docstring) accessed by
help(write_DelNorte_data)
Run all 3 functions [20%]
- Well-commented code that loops over the years 2016-19 and runs the 3 functions in turn.
To demonstrate that this has worked:
- You should show the plots corresponding to each year
- You should show the file size and modification date of the CSV files
- You should print the first few lines of the CSV files for each year
The figures in brackets indicate the percentage of marks associated with each part. Even if, for some reason, you were unable to generate outputs from your code, you should still be able to pick up marks by attempting all or most of the sections. Most of the marks are given for your computer code, so make sure this is clearly laid out and well-documented. You are expected to do a competent job of each part noted above to obtain a pass mark.
Please read these notes on what we expect of your computer code.
Word limit
There is no word limit per se on the computer codes, though as with all writing, you should try to be succinct rather than overly verbose. None of these files should be more than a few pages long: we do not want you to print or submit the datasets you download. You will be marked down if your submission is not clear.
Code style
A good to excellent piece of code would take into account issues raised in the style guide. The ‘degree of excellence’ would depend on how well you take those points on board.